19 Aug, 2026

Try This: The Purpose-Meaning-Action Data Framework

By |2026-08-19T12:44:37-04:00August 19th, 2026|Categories: Research & Evaluation|Tags: , , , , , |0 Comments

Two staff members review printed data together, with the text “Try This: The Purpose-Meaning-Action Data Framework” displayed over the image.
Try this exercise with your staff and let me know if it’s useful for you.

On the road to becoming data-driven, collecting useful data starts with understanding why you need it.

Some data helps organizations demonstrate accountability to funders, boards, leadership, participants, and other stakeholders. Other data supports learning by helping staff understand what’s working, where challenges are emerging, and how programs might improve.

Often, the same data can contribute to both purposes. The important part is determine the role the data is playing.

Understanding the purpose of a metric is a first step. Programs staff may need to consider what the information actually means and what conclusions it can reasonably support. Attendance may tell you how many people showed up yet offers limited information about what participants learned or experienced. Likewise, collecting meaningful information has limited value if no one uses it to make decisions.

The Purpose-Meaning-Action Data Framework brings these considerations together so your team can examine whether the data you’re collecting is helping you understand and strengthen your work.

Try this exercise with your staff and let me know if it’s useful for you.

Objective:

This exercise is designed to help teams examine the purpose, meaning, and potential action behind the data they routinely collect.

This Activity Is For:

  • Nonprofit program, evaluation, communications, development, and leadership staff who collect, review, or use organizational data
  • Philanthropy staff who develop reporting requirements, review grantee data, or work directly with funded organizations
  • Data and evaluation staff who want to engage colleagues in conversations about how information supports learning and decision-making

What You’ll Need:

Plan for approximately 50 to 60 minutes for this exercise. If your organization collects a significant amount of data, focus on one program, reporting process, survey, dashboard, or other manageable set of measures rather than trying to review everything at once.

For an in-person session, you’ll need:

  • A current report, survey, data dashboard, tracking form, or list of metrics your team regularly collects
  • Sticky notes
  • Pens or markers
  • Three sheets of flip-chart paper labeled PurposeMeaning, and Action
  • A timer

For a virtual session, you’ll need:

  • A digital copy of the data collection tool or report you’re reviewing
  • A shared virtual whiteboard, spreadsheet, or collaborative document
  • Three sections labeled PurposeMeaning, and Action
  • A timer

Before the session begins, select approximately three to five data points for the group to review. Choosing a smaller number allows the team to examine each one closely instead of rushing through a long list.

(more…)
12 Aug, 2026

When the Numbers Don’t Tell the Whole Story

By |2026-08-19T11:29:48-04:00August 12th, 2026|Categories: Research & Evaluation|Tags: , , , , |0 Comments

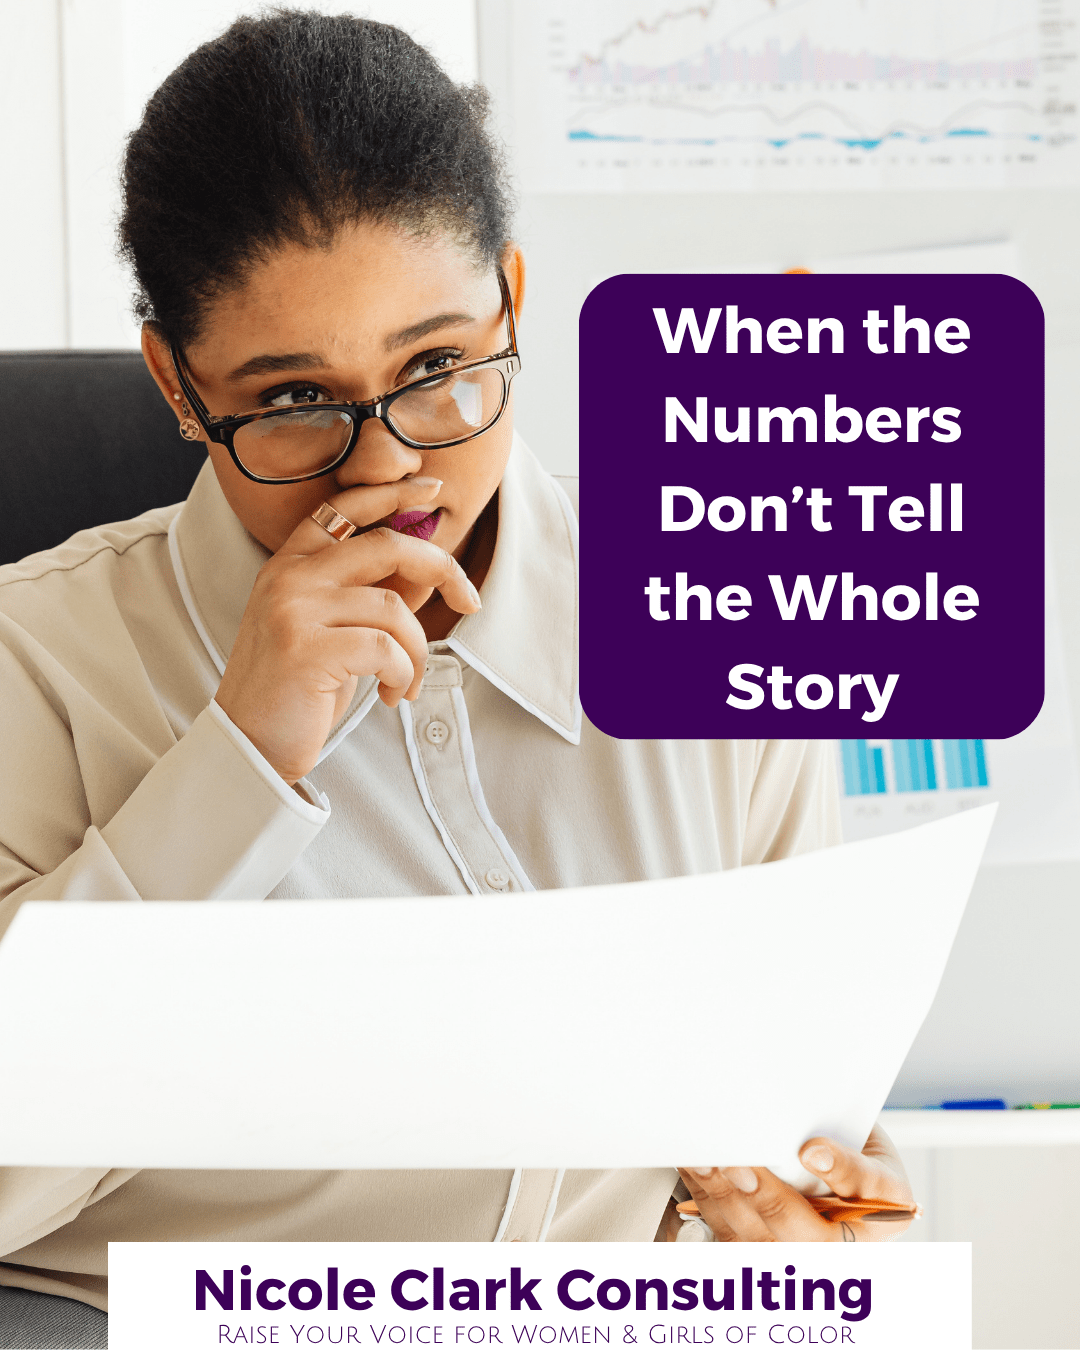
A woman wearing glasses reviews a document in front of a laptop, with charts in the background and the text “When the Numbers Don't Tell the Whole Story” displayed beside her.
Your numbers can tell you what happened, but do they tell you whether your program is making a difference?

Collecting data with a clear purpose is an important first step. Once you know why you’re collecting it, you can now ask: What does this data actually tell us? 

Nonprofits collect plenty of information about their work. Staff track participants served, events held, trainings delivered, community members reached, referrals made, resources distributed, and countless other activities. These numbers can provide useful information about what a program is doing and whether it’s reaching the people it intended to reach. However, problems arise when we expect those numbers to tell us something they can’t. A measure of activity isn’t automatically a measure of impact.

(more…)
6 Aug, 2026

Ask Nicole: Data for Learning vs. Accountability

By |2026-08-19T11:30:00-04:00August 6th, 2026|Categories: Research & Evaluation|Tags: , , , , , |0 Comments

Have a question you’d like to be featured? Let me know.

In 2017, I facilitated a focus group for participants involved in a leadership project. As part of the project, some participants received funding to implement small scaled engagement events in their local communities. One participant hosted an event to engage community members, and while the host anticipated over 100 attendees, the actual number was a quarter of that.

Based on the attendee numbers, the host shared that she didn’t think her event had been very successful because “not many people” attended.

At first glance, that conclusion made sense. We’re socialized to believe that attendance is the most visible measure of success. Fewer attendees could easily feel like a missed opportunity.

But as the conversation continued, a different story emerged.

The participants who attended remained engaged throughout the event. They asked thoughtful questions, contributed to meaningful discussions, and continued interacting after the session ended. What initially looked like a disappointing turnout became evidence of something much more valuable: The event still fostered genuine engagement.

That experience has stayed with me for years because it illustrates an important lesson about data: The numbers we collect don’t always tell the whole story.

(more…)
3 Oct, 2025

Ask Nicole: Program Updates Take Time—and That’s Okay

By |2025-10-03T13:09:08-04:00October 3rd, 2025|Categories: Program, Service, & Campaign Design|Tags: , , , , |0 Comments

Close-up photo of Nicole Clark smiling confidently, framed by a bold purple border. White text at the top reads “Ask Nicole,” and a purple banner across the middle displays the blog title: “Program Updates Take Time—And That’s Okay.” The Nicole Clark Consulting logo appears at the bottom with the tagline “Raise Your Voice for Women & Girls of Color.”
Have a question you’d like to be featured? Let me know.

I’ve talked about the moment when you realize your program’s design is outdated. Maybe the content hasn’t evolved in years. Maybe it no longer reflects your participants’ realities. Or maybe the logic model hasn’t been updated despite changing the program’s activities.

Since then, I’ve heard from many of you:

We know our program isn’t where it should be… but we’re already stretched so thin.
We want to make updates, but we don’t even know where to begin.
We feel stuck—even though we’re clear something needs to change.

If this resonates with you and your staff, you’re not alone.

Program updates take time—and that’s okay.

(more…)
24 Sep, 2025

Making Sense Together: Community-Led Data Interpretation in Practice

By |2025-09-24T12:26:53-04:00September 24th, 2025|Categories: Research & Evaluation|Tags: , , , |0 Comments

Three women sit together in a casual meeting space, smiling and discussing notes. A gold banner at the top reads “Try This.” A second banner reads: “Making Sense Together: Community-Led Data Interpretation in Practice.” At the bottom is the Nicole Clark Consulting logo with the tagline “Raise Your Voice for Women & Girls of Color.”
Try this out and let me know how it goes for you.

Collecting data is only one part of the research process. The real power lies in how that data is interpreted, understood, and applied. Too often, interpretation is treated as an internal task—reserved for staff, consultants, or funders—while the communities who shaped the data are left out of the conversation.

When we open up the analysis phase to include participants, we gain context, nuance, and insights that transform findings from raw numbers into lived truths. This is where research shifts from being about communities to being with them.

Objective:

To engage community members in collaboratively interpreting research findings and generating insights that reflect their lived experiences.

This activity is ideal for:

  • Organizations conducting surveys, focus groups, or interviews with community members
  • Teams wanting to check assumptions and ensure findings resonate with participants’ realities
  • Coalitions or partnerships looking to build trust and deepen community ownership of data

What you’ll need:

  • A set of preliminary findings (e.g., survey results, themes from interviews, charts, or quotes)
  • Simple presentation materials (slides, posters, or handouts with visuals)
  • Markers, sticky notes, or virtual collaboration tools (if online)
  • 60–90 minutes of meeting time
  • A facilitator comfortable guiding group discussions
(more…)

This Is A Custom Widget

This Sliding Bar can be switched on or off in theme options, and can take any widget you throw at it or even fill it with your custom HTML Code. Its perfect for grabbing the attention of your viewers. Choose between 1, 2, 3 or 4 columns, set the background color, widget divider color, activate transparency, a top border or fully disable it on desktop and mobile.
Go to Top